
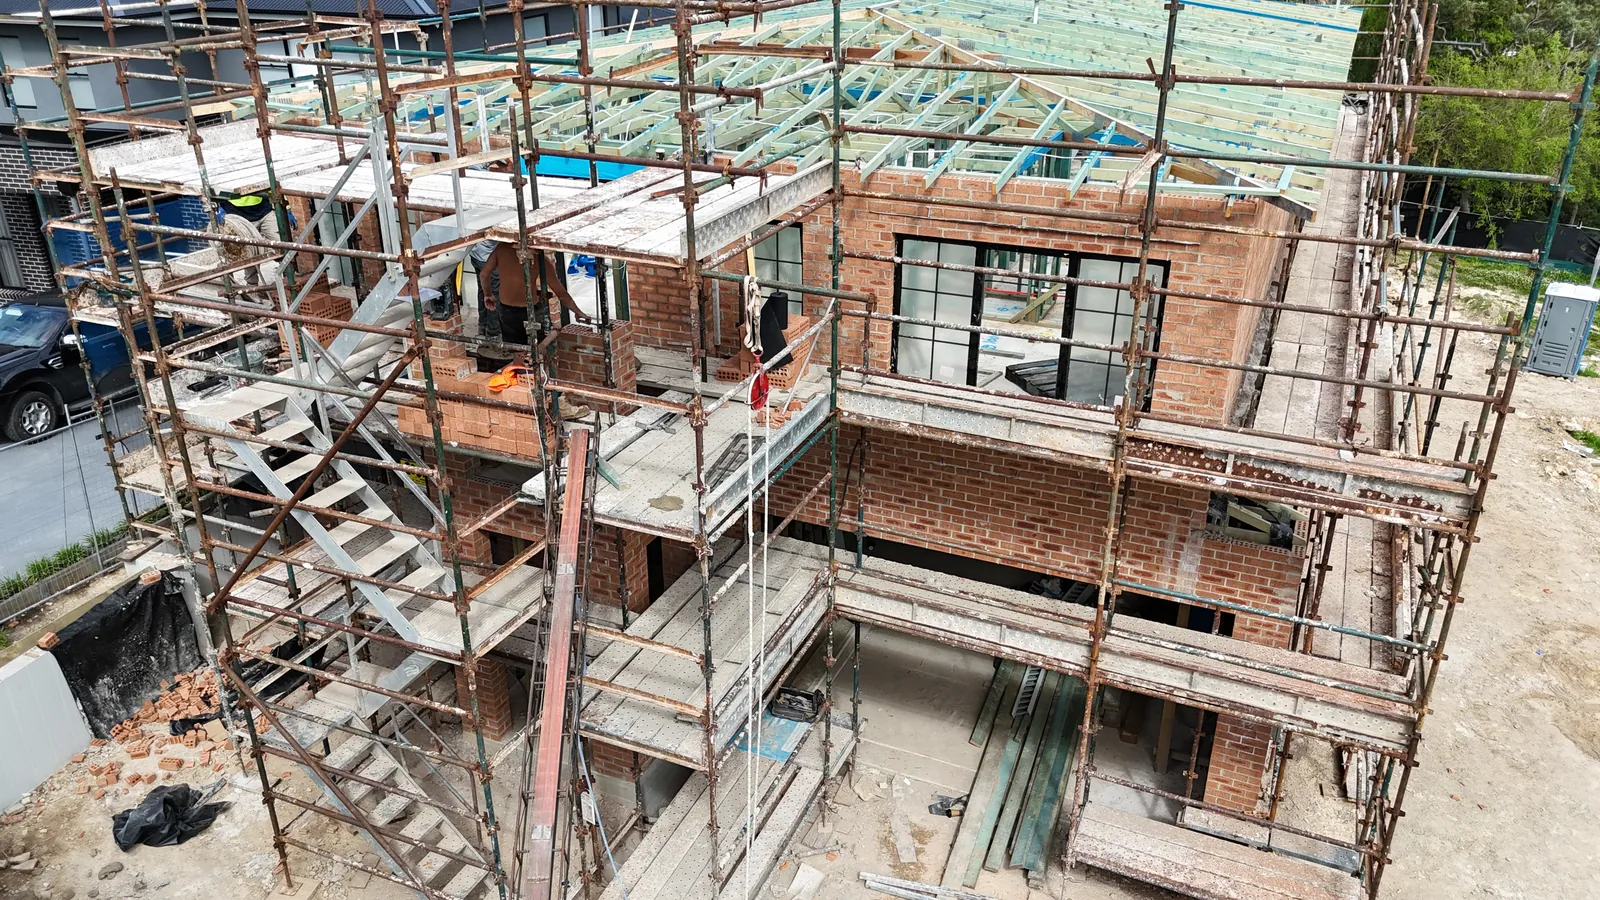
Official figures show building a new house in Sydney costs 41 percent more than it did in March 2020. In the four years before that, prices rose just 11 percent. So what changed? COVID lit the fuse, but the shortage was already there. For twenty years, governments cut and froze the training that produces tradies. Then, just as the borders closed, they paid people to start building. And they kept adding rules and charges on top.
01
The numbers at a glance
Most of the jump came in just two years, 2021 and 2022. After a pause, prices are climbing again: up 4.8 percent in the year to June 2026. This is the record, year by year. If you want to know whether prices will come down, I have answered that separately. This page is about how we got here.
What builders charge for a new house in NSW, change since March 2020
Show the figures
| Quarter | Change since March 2020 | Change on a year earlier |
|---|---|---|
| Mar 2016 | -10.2% | |
| Jun 2016 | -8.9% | |
| Sep 2016 | -8.6% | |
| Dec 2016 | -7.7% | |
| Mar 2017 | -6.1% | +4.6% |
| Jun 2017 | -5.4% | +3.9% |
| Sep 2017 | -4.2% | +4.7% |
| Dec 2017 | -3.7% | +4.3% |
| Mar 2018 | -1.9% | +4.4% |
| Jun 2018 | -1.3% | +4.3% |
| Sep 2018 | -0.8% | +3.6% |
| Dec 2018 | +0.1% | +4.0% |
| Mar 2019 | +1.0% | +2.9% |
| Jun 2019 | +0.4% | +1.7% |
| Sep 2019 | -0.4% | +0.4% |
| Dec 2019 | -1.6% | -1.7% |
| Mar 2020 | 0% | -0.9% |
| Jun 2020 | -0.4% | -0.8% |
| Sep 2020 | -0.5% | -0.1% |
| Dec 2020 | +0.4% | +2.1% |
| Mar 2021 | +0.1% | +0.1% |
| Jun 2021 | +2.2% | +2.6% |
| Sep 2021 | +6.1% | +6.7% |
| Dec 2021 | +9.0% | +8.5% |
| Mar 2022 | +13.6% | +13.5% |
| Jun 2022 | +19.1% | +16.5% |
| Sep 2022 | +24.6% | +17.4% |
| Dec 2022 | +26.8% | +16.3% |
| Mar 2023 | +31.1% | +15.4% |
| Jun 2023 | +32.1% | +10.9% |
| Sep 2023 | +34.4% | +7.9% |
| Dec 2023 | +35.5% | +6.9% |
| Mar 2024 | +35.0% | +3.0% |
| Jun 2024 | +35.2% | +2.3% |
| Sep 2024 | +36.4% | +1.5% |
| Dec 2024 | +35.2% | -0.2% |
| Mar 2025 | +33.9% | -0.8% |
| Jun 2025 | +34.7% | -0.3% |
| Sep 2025 | +36.4% | +0.0% |
| Dec 2025 | +38.0% | +2.1% |
| Mar 2026 | +38.5% | +3.4% |
| Jun 2026 | +41.2% | +4.8% |
The average approved house figure includes homes getting bigger and better finished, so it overstates the price rise. But it is what people are actually signing up for, by the ABS building approvals. These are averages across the whole market. For what a custom home in the Hills or on the North Shore costs line by line, here is a real tender from one of our homes.
Sydney building materials, rise on the 2019 average to September 2025
02
How the shortage was built, long before COVID
The trades shortage did not start in 2020. It was built over the decade before, by governments that cut training while the industry was quiet and assumed it would never matter.
The incentives went first. In the 2012 Budget, Canberra cut back the $1,500 payment employers received for taking on an apprentice, saving $353.6 million over four years. In the 2014 Budget, Tools for Your Trade was scrapped: $914.6 million in payments that helped apprentices buy their tools, replaced with $439 million in loans they had to repay. The core payment an employer receives for taking on an apprentice has not changed since 1998. The Productivity Commission found it covers less than 2 percent of what an apprentice costs to train.
Then TAFE. Government funding for each hour of vocational training fell from $16.60 in 2006 to $11.36 in 2014, after inflation. In New South Wales, state funding for TAFE and vocational training fell from $1.27 billion a year in 2006 to $826 million in 2017, after inflation, almost 35 percent lower. Nationally, funded training hours fell 31 percent between 2012 and 2018, according to the Mitchell Institute.
I studied landscaping at Ryde TAFE in 2005, and went back to TAFE for irrigation in 2009. Back then the place was buzzing. It was a great place to be. Go back now and it feels like a ghost town, and the facilities are not what they used to be.
University became the default. In 2012 governments uncapped university places, and domestic bachelor students rose from 577,000 in 2009 to 769,000 in 2017. The national vocational research body suggested this partly explains why apprenticeships fell. The message to every school leaver was clear, and it was not “learn a trade”.
What it did to the numbers. Trade apprentices in training fell 19 percent between mid 2012 and the end of 2015, from 216,600 to 175,000. In construction trades, new starts went from 22,899 in the year to June 2018, to 19,364 in 2019, to 18,667 in 2020. That was just as the biggest building boom in a generation was starting.
Once the wage subsidy ended, they fell back again: 18,815 in the year to June 2025, about where they were in 2006. And of the construction apprentices who do start, only 57.7 percent finish within six years.
That matches what I see on site. There are fewer apprentices on my jobs than there used to be, and plenty of the ones I do see never finish. They leave partway through for other industries where they believe the money is better. Most of the trades I rely on are now over 40.
Ready when we needed them? A carpentry or bricklaying apprenticeship in NSW runs 48 months. So the tradies who qualified during the 2020 to 2022 boom were the ones who started four years earlier, in the quiet years. There were no more of them than usual: about 11,000 finished in 2021, much the same as in 2019. The wage subsidy apprentices who started in 2021 and 2022 are only finishing now, 15,502 in the year to June 2025, years after the rush they were paid for. And in 19 of the last 20 years, more construction apprentices quit than finished. In 2022, 19,559 left and 12,800 completed.
Starting, finishing and leaving: construction apprentices, 2006 to 2025
StartedFinishedLeft
Show the figures
| Year to June | Started | Finished | Left |
|---|---|---|---|
| 2006 | 18,648 | 7,358 | 11,026 |
| 2007 | 21,089 | 9,338 | 12,165 |
| 2008 | 24,204 | 11,023 | 13,911 |
| 2009 | 17,489 | 11,612 | 14,319 |
| 2010 | 22,202 | 11,688 | 14,181 |
| 2011 | 21,773 | 12,611 | 15,379 |
| 2012 | 17,219 | 13,243 | 15,778 |
| 2013 | 17,300 | 11,125 | 13,992 |
| 2014 | 17,959 | 14,138 | 12,350 |
| 2015 | 23,993 | 9,418 | 15,506 |
| 2016 | 22,717 | 9,935 | 15,437 |
| 2017 | 21,681 | 9,664 | 16,454 |
| 2018 | 22,899 | 10,668 | 17,505 |
| 2019 | 19,364 | 11,494 | 17,608 |
| 2020 | 18,667 | 11,181 | 15,523 |
| 2021 | 28,950 | 11,033 | 15,847 |
| 2022 | 30,826 | 12,800 | 19,559 |
| 2023 | 23,779 | 13,159 | 19,329 |
| 2024 | 22,307 | 12,803 | 19,016 |
| 2025 | 18,815 | 15,502 | 17,607 |
Why nobody noticed. Shortages come and go. In 2007 to 2008, 97 percent of trade occupations were in shortage. By 2014 to 2015 it was just over 40 percent, so cutting training looked like a free saving. By September 2019, with building slowing, the HIA’s trades index already showed a shortage again. Then 2020 arrived.
03
2020 and 2021: the fuse is lit
When COVID arrived, governments did what governments do in a downturn: they paid people to spend. In building, that was a mistake, because the industry was not short of demand. It was short of people.
The Reserve Bank cut interest rates to a record low of 0.10 percent by November 2020. That is the Reserve Bank’s own rate, the one every home loan follows. In June 2020 Canberra launched HomeBuilder, paying $25,000 to eligible owners who signed a contract to build or renovate. By the end of 2021 it had received 137,621 applications, 25,934 of them from NSW, backing $41.6 billion of work. The final cost was almost four times what had been budgeted. Private house approvals hit a record in March 2021.
In the same months, the border was shut. For the first time since 1946, more people left Australia than arrived: 88,800 more in 2020 to 2021. Governments paid people to start building at the same moment they closed the door on the workers who might have built it, on top of a decade of cuts to training.
The materials followed. Structural timber rose 15.4 percent in a single quarter at the end of 2021, and at the peak, timber, board and joinery cost 24.2 percent more than a year earlier.
On our jobs, we could not even get a quote from our frame and truss companies. We had to call company after company to find anyone who would price the work, and negotiating was not even a question. You took the price or you did not get a frame.
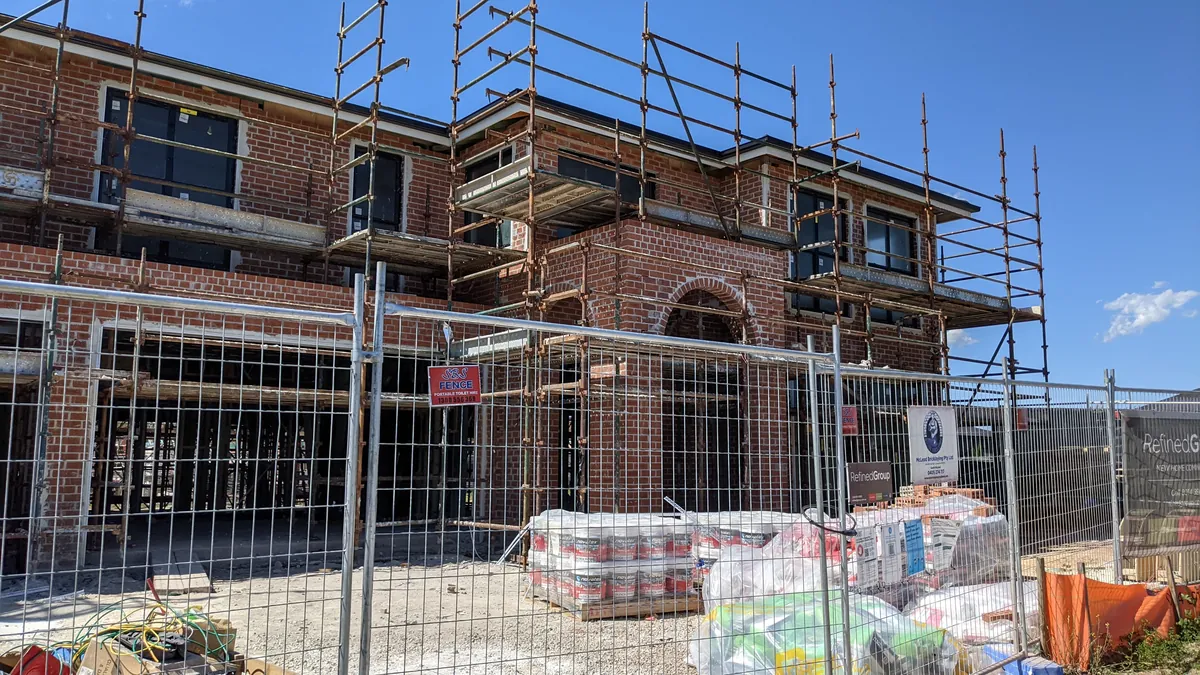
Then, in July 2021, every construction site in Greater Sydney was shut for two weeks by health order.
This was not only an Australian story. In New Zealand, the price of new homes rose 16.4 percent in the year to June 2022, almost exactly what we saw here. COVID, shipping and timber hit every country. What was ours was the decade of cuts before it, and the decisions that came after it.
04
2022 and 2023: the squeeze
The bill arrived in 2022. Builders’ prices in NSW rose 17.4 percent in the year to September 2022, the steepest rise in the last ten years. Between March 2021 and March 2023 they rose 31 percent, which is why I have said before that building rose at least 30 percent in about two years. Builders who had signed fixed price contracts a year earlier were wearing the difference. In October 2022 the Reserve Bank reported that more than a quarter of the country’s 200 largest home builders had made an operating loss, up from about 15 percent the year before. Materials had risen more than 20 percent since the start of 2021.
Then the money got dear. Between May 2022 and November 2023 the Reserve Bank raised interest rates 13 times, from 0.10 percent to 4.35 percent. On a $1 million home loan, a rise that size adds roughly $2,500 a month to the repayments.
Interest rates: the Reserve Bank’s rate, which home loans follow
On 31 March 2023, Porter Davis went into liquidation with about 1,700 homes under construction and 779 not yet started. Lloyd Group failed the same day, with 59 projects, 30 of them in NSW. Building company collapses in NSW went from 498 in 2019 to 2020 to 981 in 2022 to 2023, and peaked at 1,567 in 2024 to 2025. Last financial year there were 1,540. I have written about why size is no protection here.
NSW building companies entering administration, by financial year
Meanwhile the border reopened, and net overseas migration hit a record 538,000 in 2022 to 2023. Migrants make up about a quarter of the construction workforce, but in 2024 Master Builders found that fewer than 3 in every 100 construction workers had arrived in the last five years. Governments brought in record numbers of people who need homes, and almost none of the people who build them.
Did builders pocket the difference? It is a fair question. Over the five years to June 2026, Cotality’s index of what it costs to build a standard home, counting materials, labour and equipment but not the builder’s margin, rose 29.5 percent nationally. Over the same five years, the ABS measure of what builders charge rose 42.5 percent. If that gap were profit, builders would have been thriving. They were not: more than a quarter of the largest were losing money in 2022, and collapses kept climbing until 2025. In my view the gap is builders pricing in the risk they learned they could not carry on a fixed price.
05
The rules got more expensive too
Not every cost in a new home comes from the market. Some of it is written into law, and the list keeps growing.
It has been building for a long time. In 2025 the Productivity Commission found that housing construction productivity has fallen 12 percent since the mid 1990s, while across the rest of the economy it rose 49 percent. On the simplest measure, we now finish half as many homes for every hour worked as we did in 1995. The Commission’s chair put part of the blame plainly: “The sheer volume of regulation has a deadening effect on productivity.”
BASIX and 7 stars. From 1 October 2023, NSW lifted the thermal standard for new homes under BASIX from an average of 5.5 to 6 stars to 7 stars, on an energy rating scale that runs to 10. The same change brought tougher energy targets and a new requirement to calculate the carbon in the building materials. Government says the average home will save about $1,070 a year on power. Nobody agrees on what it adds to the build: industry estimates go up to $25,000 a home, while the regulator’s own consultant put it at $464 to $7,830.
On our homes, double glazing has become the norm on many jobs, and insulation is now a big part of the build, both of which add cost. But the materials are only part of it. Every extra requirement brings consultants with it, and time to get it right before anything can be built. Those costs never show up in an estimate of what 7 stars adds to a house.
The paperwork is now a trade of its own. Stormwater requirements seem to grow every year. Every home needs an energy assessor. The documentation certifiers ask for has grown, and lodging through the government portals is now complicated enough that it cannot simply be done by a homeowner. There are specialist consultants whose whole job is that work, and every one of them is a fee and a wait before a slab is poured.
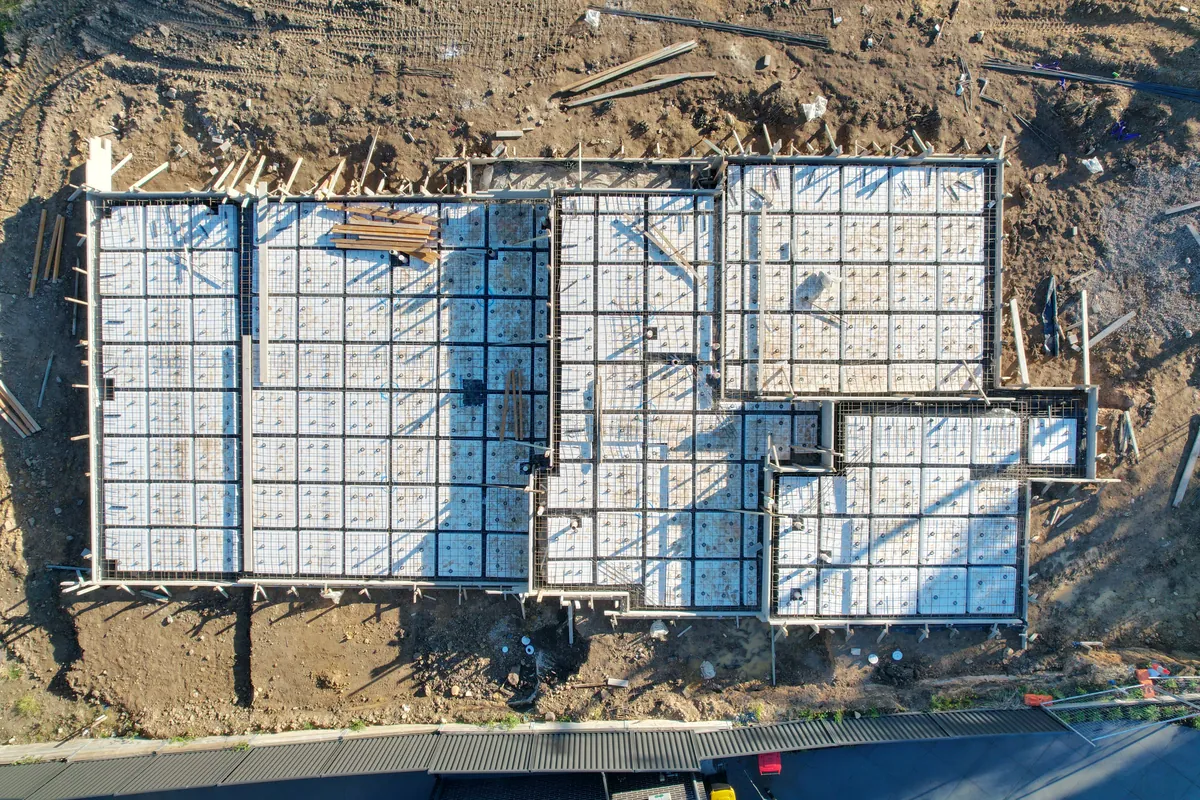
The levies. The NSW long service levy is 0.25 percent of the building cost on any work over $250,000, about $2,500 on a $1 million build, paid before work starts. The home warranty insurance every builder must buy for you went up for new homes from 1 November 2025. Then there are council fees, the certifier and the BASIX certificate itself.
The estates stopped being the cheap option. The new estates on the edge of Sydney were always meant to be the way in: the affordable option for first home buyers who could not compete for an established house. Not any more. The HIA puts government taxes and charges at $576,000, about half the price of a new Sydney house and land package, and $160,000 more than in 2019. On those numbers a new package now costs well over $1 million, and half of it is taxes and charges. Since October 2023, the state has also charged $12,000 for every new lot created in Greater Sydney.
Waiting is a cost too. Between 2019 and 2024, the average time to build a house in NSW rose from about 7 months to about 10.5 months. That average covers all builders and is mostly project homes; a custom home takes longer. Every month a project waits is a month of price movement on a quote priced for today. In fairness to councils, the state reports average assessment times have come down from 115 days to 84, with tighter targets to come.
And the next round is already coming. NSW has given itself an extra 12 months on the new National Construction Code, which takes effect here from 1 May 2027. That is a breather, not a reprieve.
06
2026: rising again
Prices are moving again. Electrical cable and conduit rose 20 percent in the June 2026 quarter alone, and the national housing supply council has pointed to fuel prices driven by the conflict in the Middle East. The Reserve Bank has raised interest rates four times this year, to 4.60 percent, the highest since 2011. Meanwhile Sydney house values fell 8.2 percent in the year to September 2026. Where prices go from here, and why the pressure is landing on land, I have covered separately.
And the promises keep growing. Australia has about 2.3 million more people than it did in March 2020, about half a million of them in NSW. Governments committed to 1.2 million new homes over five years from July 2024. After seven of the twenty quarters, 308,000 had been built, and the target is now not expected before the end of 2030. NSW has built about a fifth of its share. More homes cannot be legislated into existence. They have to be built by people who were trained, with materials that were made, under rules that can be met.
07
What it means if you are building now
Price for today, not for 2019. Any figure you remember from before 2020 is gone, and any calculator built on old averages will be wrong in one direction only. Here is what one of our homes actually cost, line by line.
Fix the price where you can. With documented plans, a fixed price contract puts the risk of the next price rise on the builder rather than on you. Here is how fixed price and cost plus compare.
And once the plans are right, do not sit on the tender. Everything on this page points the same way.
If you are planning a build, talk to us while your plans are still being drawn. That is when a builder can tell you what the design will cost, before it is locked in.
The decisions behind the numbers
- 2006 to 2017TrainingNSW state funding for TAFE and vocational training fallsAlmost 35 percent lower in real terms Source
- Jul 2012TrainingFederal Budget cuts back the $1,500 apprentice hiring incentive$353.6 million saved over four years Source
- 2012TrainingUniversity places uncappedDomestic bachelor students up 191,000 by 2017 Source
- May 2014TrainingTools for Your Trade scrapped$914.6 million of payments replaced with loans Source
- Sep 2019Supply and pricesTrades already in shortage with building slowingHIA trades index below zero Source
- Mar 2020Supply and pricesBorder closesNet migration negative for the first time since 1946 Source
- Jun 2020Stimulus and demandHomeBuilder launched137,621 applications; final cost almost four times the budget Source
- Oct 2020TrainingApprentice wage subsidyAbout 191,000 extra starts, about 77,000 in trades Source
- Nov 2020Interest ratesInterest rates cut to a record low0.10 percent Source
- Mar 2021Stimulus and demandPrivate house approvals hit a recordDemand peaks while supply is short Source
- Jul 2021Supply and pricesEvery Greater Sydney construction site shutTwo weeks by health order Source
- Dec 2021Supply and pricesStructural timber jumpsUp 15.4 percent in one quarter Source
- May 2022Interest ratesFirst of 13 interest rate rises0.10 percent to 4.35 percent by November 2023 Source
- Sep 2022Supply and pricesNSW builders’ prices peak in growthUp 17.4 percent in a year Source
- Oct 2022Supply and pricesBuilders on fixed price contracts losing moneyOver a quarter of the top 200 in loss Source
- Mar 2023Supply and pricesPorter Davis and Lloyd Group fail on the same dayAbout 1,700 homes under construction Source
- 2022 to 2023Stimulus and demandRecord net overseas migration538,000 people Source
- Oct 2023Rules and chargesBASIX lifts new homes to 7 starsIndustry estimates up to $25,000 a home Source
- Oct 2023Rules and chargesHousing and Productivity Contribution starts$12,000 per new lot in Greater Sydney Source
- Jul 2024Rules and charges1.2 million homes promised over five years308,000 built after seven of twenty quarters Source
- 2024 to 2025Supply and pricesNSW building company collapses peak1,567 in one financial year Source
- Nov 2025Rules and chargesHome warranty insurance premiums rise for new homesFrom 1 November 2025 Source
- Jun 2026Supply and pricesElectrical cable and conduit jumpUp 20 percent in one quarter Source
- Sep 2026Interest ratesFourth interest rate rise of the year4.60 percent, the highest since 2011 Source
- May 2027Rules and chargesNew National Construction Code takes effect in NSWAfter an extra 12 month transition Source
Where these numbers come from
ABS Producer Price Indexes (house construction output and inputs), ABS Building Approvals, Master Builders NSW analysis of ABS input costs, the Parliamentary Library, Budget Papers 2012 to 2013 and 2014 to 2015, the Productivity Commission, the Mitchell Institute, NCVER, Treasury, the Reserve Bank of Australia, ABS overseas migration, ASIC data via Master Builders NSW, Master Builders Australia, NSW Planning, the Long Service Corporation, icare, the HIA, the National Housing Supply and Affordability Council, Cotality, ABS population figures and Stats NZ. Each figure above links to its source. Figures checked 21 to 23 October 2026.